Menu
Log in


News & Media releases

<< First  < Prev   ...   25   26   27   28   29   Next >  Last >> 
  • 23 Apr 2019 3:37 PM | Marie-Louise Rankin (Administrator)

    Dr Ingrid Aulike, a University of Queensland statistician, won the “Women in Big Data” data challenge for 2019. Her presentation was a masterclass in exploratory data analysis and the importance of not making assumptions about data. Participants were given a dataset with a series of numbers with no apparent meaning. By challenging typical assumptions about data e.g. columns are variables or features, and using different visualisation techniques to summarize the data, Dr Aulike uncovered the hidden figure in this dataset of numbers, an image with a message, “Data Should Be Seen”. In her interview, Dr Aulike highlighted the need for statisticians with strong technical background and consultancy skills to meet the challenges in Big Data. She  credits online courses such as Statistical Learning with Hastie and Tibshirani, Andrew Ng’s Deep Learning and Bill Howe’s Data Science at Scale courses on Coursera as professional development opportunities for statisticians to upskill to address the needs and challenges of Big Data. Congratulations to Dr Aulike!


    Jeeva Kanesarajah, PhD Candidate
    SSA-QLD Newsletter correspondent
    The University of Queensland, School of Public Health
    raven17786@gmail.com


  • 12 Apr 2019 10:04 AM | Marie-Louise Rankin (Administrator)

    WA Branch April meeting

    The April meeting of the Western Australian Branch heard Professor Inge Koch present a talk Analysis of Proteomics Imaging Mass Spectrometry Data. It was a particularly significant meeting as it also celebrated Inge taking up the role of Professor of Statistics and Data Science at the University of Western Australia.

    Mass spectrometry measures the weights of charged particles. In this case the particles are fragments of protein molecules from tissue samples and the masses provide signatures for particular proteins. The imaging aspect of the problem is that measurements in the form of mass spectra are recorded over a regular grid of points (or pixels) across the tissue sample. The resulting data is complex, with the spatial aspect of the image overlaid with the need to statistically understand the mass spectra. Effectively each spectrum is a high dimensional vector, typically around 13,000 to 15,000 values so the whole dataset can be thought of as a three dimensional array of data points, with two spatial dimensions and one mass dimension

    Inge’s work has come out of a successful collaboration in Adelaide with several biochemists, particularly Lyron Winderbaum and Peter Homann. The aim is to develop methods of identifying features such as cancerous or pre-cancerous cells in a tissue sample without the high cost of an experienced pathologist examining a stained tissue sample under a microscope (the left image below), a process that can take hours.

    Inge described several approaches, including images corresponding to the spectra at a single mass (termed feature maps), through to conventional multivariate methods such as principal components, clustering techniques and mixture models. However the feature maps based on a single mass tended to be poor at identifying features in the tissue while the multivariate methods tended to also produce poor images.

    The solution was to convert the mass spectra to binary data (presence or absence at each mass), applying a spatial smoothing to the mass data and replacing the Euclidian norm (L2) with the cosine distance. The last is a technique perhaps better known amongst data scientists rather than mainstream statisticians, but its use is growing with high dimensional data. The results are promising in identifying different tissue types as in the central image below.

    A final step has been to incorporate knowledge of what actually are cancerous cells to train the methods and select variables (masses) that best distinguish between cancerous and non-cancerous cells. The principle is to find masses that occur predominantly in cancer spectra but not outside, by looking at differences in proportions (DIPPS). The right image below shows the effectiveness of this.


    The stained tissue sample with cancerous areas marked (left), the results of cluster analysis (centre) and the prediction from masses chosen by the DIPPS principle (right).


    After the meeting a number of members joined Inge for an enjoyable meal at a local restaurant, where the null hypothesis that statisticians are boring and unsociable was firmly rejected.

    John Henstridge 

  • 8 Apr 2019 10:01 AM | Marie-Louise Rankin (Administrator)

    South Australian Branch SSA Meeting: March 2019

    The speaker for the March meeting of the SA Branch was Claire Clarke, a methodolgist at the Australian Bureau of Statistics (ABS). Claire gave an engaging talk on the methods being developed at the ABS to improve coordination of samples selected for its household and business surveys.

    The ABS conducts a wide variety of sample surveys on social and economic topics. Since different ABS surveys often sample from the same population, sample selection needs to be coordinated in order to manage the survey load placed on individual households and businesses. Also, sample coordination does not always seek to minimise overlap: for surveys which produce estimates every month or every quarter, it is desirable to have high overlap between the samples selected in successive periods. Under the design-based sampling framework used for ABS surveys, a requirement of the sample coordination method is that it preserves each unit’s selection probability specified in the sample design.

    For many years the ABS has applied the ‘synchronised selection’ method to achieve sample coordination of its business surveys. Claire explained the method is not particularly flexible, and so the goals of sample coordination are not achieved when units change strata or there are extensive changes to the structure of the sampling frame.

    The general ‘Conditional Selection’ method which the ABS has been developing largely addresses the limitations of synchronised selection. Under Conditional Selection, units belonging to the same sampling stratum are selected with different probabilities according to their history of selection across previous surveys. For example, assuming it is desirable to minimise the extent of overlap between the sample for an upcoming survey and the samples of previous surveys, for the upcoming survey the units in the population which have not been previously selected will have highest conditional probability. Claire used an example to explain the calculation of the conditional probability. She illustrated how the probability associated with each potential selection history can be used to ensure each unit is selected with the desired unconditional probability.

    In the second half of her talk Claire discussed practical issues for implementation. One such issue is controlling the sample size within each stratum. If it is necessary to control the sample size in each stratum, the selection method needs to be adapted and it is not possible to precisely preserve the desired unconditional probabilities. Another issue is managing the selection history data. Although the selection history (and associated probability the history) must be tracked for every unit in the population, the storage requirements are manageable because the number of possible histories for each unit increases linearly with the number of prior surveys being tracked.

    The ABS is in the process of adopting the Conditional Selection method, and it has already been applied for selection for some ABS household surveys.

    By Julian Whiting

  • 4 Apr 2019 1:46 PM | Marie-Louise Rankin (Administrator)

    On March 19 the Victorian Branch held its first meeting of 2019. The Branch’s AGM was followed by Dr Shirley Coleman discussing how she has demonstrated the impact of her work with industry partners.

    Dr Coleman’s seminar on demonstrating impact was a great insight into the mutually beneficial relationship between the Industrial Statistics Research Unit (ISRU, Newcastle University, UK) and small to medium enterprises (SMEs). In order to maintain funding, one of the requirements of university departments in the UK is to demonstrate the impact of the research they conduct. Dr Coleman walked us through a few examples where the research unit she directs has engaged industry to apply statistical thinking and methods to help SMEs make sense of their data.

    Examples included working with a gas utility company to improve supply forecasting, and analysing auto parts lookup data to determine the average lifecycle of particular auto parts and how this varied by brand. The results of the ISRU’s work with industry partners meant there was a tangible figure to demonstrate the impact of their research – such as the amount of money saved by the utility provider due to the better estimates of supply.

    Doing this work with industry was not without its challenges however, as Dr Coleman discussed. Often the industry partners were hesitant when it came to publications, a key requirement of demonstrating impact, voicing their concerns about their operational data and conclusions drawn from it being available in the public domain. Not only does the ISRU have to placate their industry partners, they also have to work within strict rules on which journals can count towards demonstrating impact. Dr Coleman’s seminar was particularly timely with the renewed focus of Australian funding bodies on the demonstration of the impact of research: her lessons on how to do this will surely be heeded by many audience members!

    The seminar was preceded by the Victorian Branch’s AGM, at which Dr Damjan Vukcevic was welcomed as incoming President of the Branch, and Dr Rheanna Mainzer and Ben Harrap were welcomed to the council. Prof Ian Gordon and Dr Nick Tierney were farewelled, and we thank them for their hard work on the council.

    Ben Harrap

  • 3 Apr 2019 2:51 PM | Marie-Louise Rankin (Administrator)

    Back in the black, but vision for science veers off track

    The 2019/2020 Federal Budget has missed the opportunity to invest in solution-making scientific and technological research and Australia’s world-class institutions and agencies that make it possible.

    President of Science & Technology Australia, Professor Emma Johnston AO, said the Federal Budget was a mixed result for Australia’s science and technology driven future. Read more here


  • 13 Mar 2019 7:30 AM | Marie-Louise Rankin (Administrator)

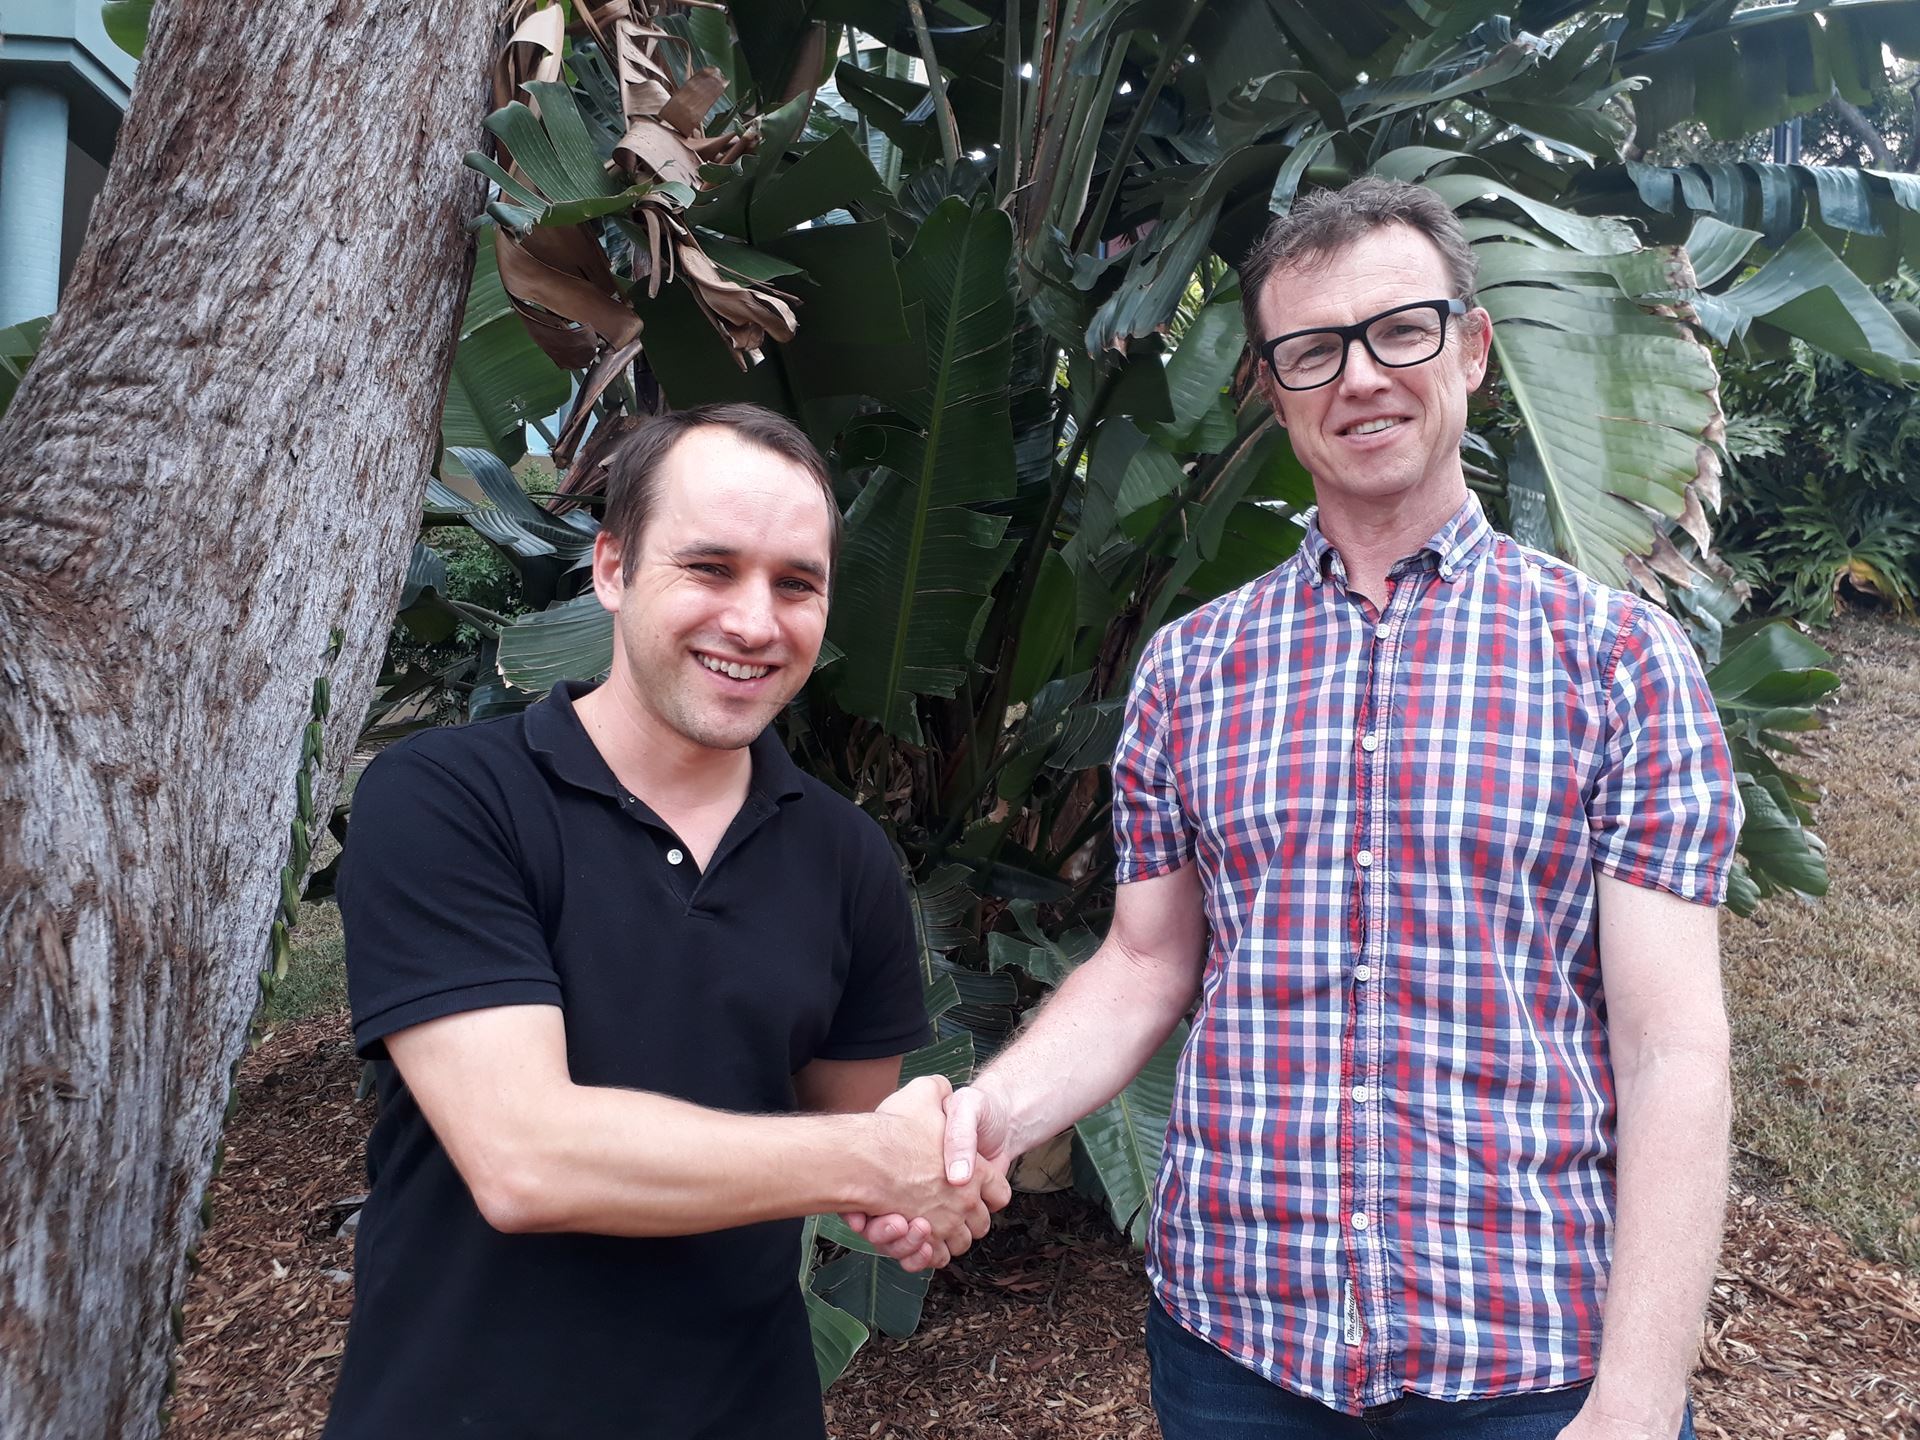
    Dr Michael Waller, BCA Program Coordinator at the University of Queensland, accepts the Award on behalf of member universities, from Prof Adrian Barnett

    Dr Michael Waller, BCA Program Coordinator at the University of Queensland, accepts the Award on behalf of member universities, from Prof Adrian Barnett


    The Statistical Society of Australia has awarded the 2019 President’s Award for Leadership in Statistics to the Biostatistics Collaboration of Australia (BCA).

    This award is for the BCA’s outstanding contribution to statistics based on their sustained work since 2001 to provide Australia with much needed skills in biostatistics, which includes research in genetics, clinical trials and public health.

    The BCA has a great national reputation and its students are highly prized for jobs in health and medical research, an area that has a growing need for statistical skills because of the increasing size and complexity of data.

    The President of the Statistical Society of Australia, Professor Adrian Barnett, said, “The BCA has been of enormous national value for the field of statistics. It has brought together some of our most experienced statisticians to pass on their skills to students. I know that other fields have aimed to copy the BCA’s collaborative model, which is the ultimate form of flattery.”

    The BCA is a consortium of biostatistical experts from across Australia with representatives from universities, government and clinical practice who have combined to offer a national (and international) program of postgraduate courses via an alliance of six universities, being The University of Adelaide, Macquarie University, Monash University, The University of Queensland, The University of Sydney and the University of Melbourne (affiliate member).

    It was established because of the national shortage of statisticians with expertise in the health industry and medical research, and has served to raise the standard of scientific rigour in health and medical research.

    The BCA has graduated 552 students since 2001 and at the start of semester one, 2019, there were 387 students enrolled in the BCA program.

    “The BCA has filled an important gap in our national skill set, and at the 2018 national Statistical Society conference there was a strong consensus that Australia needs more investment in biostatistics to meet the growing demand.” Professor Barnett said. 
  • 12 Mar 2019 12:44 PM | Marie-Louise Rankin (Administrator)

    South Australian Branch Meeting, February 2019

    Fernando Marmolejo-Ramos is a visiting research fellow at the School of Psychology and casual lecturer at the School of Education, both at the University of Adelaide. From November 2014 to December 2016, he was a postdoctoral research fellow at the Department of Psychology at Stockholm University (Sweden). His research interests include the embodiment of language and emotions, cross-modality, and statistics/methodology. So it was good to have Fernando give an informative and interesting talk about making the most of your curves, with a sub-title towards robust and distributional approaches to data description and analyses.

    The goal of Fernando’s talk was to highlight how the shape of the data can be better described by identifying their location, scale and shape parameters. Across many fields it’s canonical to describe data in terms of means and standard deviations. While such estimations of location and scale are appropriate for normally distributed data, more often than not data tend to follow non-normal shapes (e.g. reaction times). Fernando used a range of datasets from different fields to highlight his points. Indeed, most statistical tests assume normality and homogeneity of variance in order to output unbiased results; therefore, biased results occur when data do not meet those assumptions.

    For more information contact fernando.marmolejoramos@adelaide.edu.au .

    By Paul Sutcliffe


  • 28 Feb 2019 2:15 PM | Marie-Louise Rankin (Administrator)

    Outstanding contributions to science have been recognised by the Australian Academy of Science with 20 of Australia’s leading scientists receiving a 2019 honorific award. One of them is our very own Professor Alan Welsh FAA, Australian National University. Read more here.


  • 24 Aug 2018 9:00 AM | Marie-Louise Rankin (Administrator)

    Big data is exploding so rapidly around the world, there are not enough skilled operators to handle and interpret it.

    The demand for expert data professionals is outstripping supply many times over, an international group of scholars and educators warned today.

    Details of a global project to beef up the teaching of data studies in high schools in countries around the world and to train school teachers in data science, as a science of central importance to the human future have been released by the group.

    “The last decade has seen spectacular growth in data collection and usage in most areas of human endeavour – from government to business, to health, science and the environment,” a spokesman for the group, Nick Fisher, said.

    “The scale and complexity of the data now being amassed are far beyond the ability of single computers or individuals to manage. We need teams of data science experts working together in real time, around the world. That is why we have launching an urgent project aimed at meeting the global shortfall in trained data science professionals.

    “At the same time there is an urgent need for ordinary people to be able to understand and use the data now available to them – whether it is about their health, their financial situation, in their job or education.”

    “The project is a collaborative activity involving leading computer scientists, statistical scientists, curriculum experts and teachers from Australia, Canada, England, Germany Holland, New Zealand and the USA and supported by several national and international societies, groups and companies. 

    The aim of the International Data Science in Schools Project (IDSSP) is to transform the way data science is taught the last two years of secondary school.  Its objectives are:

    1. To ensure that school children develop a sufficient understanding and appreciation of how data can be acquired and used to make decisions so that they can make informed judgments in their daily lives, as children and then as adults
    2. To inspire mathematically able school students to pursue tertiary studies in data science and its related fields, with a view to a career.

    “In both cases, we want to teach people how to learn from data,” Dr Fisher said.

    Two curriculum frameworks are being created to support development of a pre-calculus course in data science that is rigorous, engaging and accessible to all students, and a joy to teach.  

    • Framework 1 (Data Science for students).  This framework is designed as the basis for developing a course with a total of some 240 hours of instruction.
    • Framework 2 (Data Science for teachers).  As a parallel development, this framework is designed as the basis for guiding the development of teachers from a wide variety of backgrounds (mathematics, computer science, science, economics, …) to teach a data science course well.      

    Dr Fisher said that the draft frameworks will be published for widespread public consultation in early 2019 before completion by August.

    “We envisage the material will be used not just in schools, but also as a valuable source of information for data science courses in community colleges and universities and for private study.”

    For further information:  idssp.info@gmail.com, or visit www.idssp.org.

  • 18 Aug 2018 12:58 PM | Marie-Louise Rankin (Administrator)

    One of the outcomes that emerged from ISCB-ASC2018 held in Melbourne in August 2018 was a Statement of Action on Statistics in Health and Medical Research.

    This statement identifies urgent priority areas for action by relevant stakeholders (funding agencies, academic sector, biostatistics research community and professional societies) to protect and grow Australia’s capacity and leadership in the critical field of biostatistics. The statement emerged from a meeting of conference delegates held on Thursday 30 August 2018 to discuss the importance of biostatistical methodology to ensuring the value of health and medical research, and our national capacity and needs in this area. The background to these discussions is summarised and the action points identified 
    here.  

<< First  < Prev   ...   25   26   27   28   29   Next >  Last >> 
Powered by Wild Apricot Membership Software