WA Branch April meeting
The April meeting of the Western Australian Branch heard Professor Inge Koch present a talk Analysis of Proteomics Imaging Mass Spectrometry Data. It was a particularly significant meeting as it also celebrated Inge taking up the role of Professor of Statistics and Data Science at the University of Western Australia.
Mass spectrometry measures the weights of charged particles. In this case the particles are fragments of protein molecules from tissue samples and the masses provide signatures for particular proteins. The imaging aspect of the problem is that measurements in the form of mass spectra are recorded over a regular grid of points (or pixels) across the tissue sample. The resulting data is complex, with the spatial aspect of the image overlaid with the need to statistically understand the mass spectra. Effectively each spectrum is a high dimensional vector, typically around 13,000 to 15,000 values so the whole dataset can be thought of as a three dimensional array of data points, with two spatial dimensions and one mass dimension
Inge’s work has come out of a successful collaboration in Adelaide with several biochemists, particularly Lyron Winderbaum and Peter Homann. The aim is to develop methods of identifying features such as cancerous or pre-cancerous cells in a tissue sample without the high cost of an experienced pathologist examining a stained tissue sample under a microscope (the left image below), a process that can take hours.
Inge described several approaches, including images corresponding to the spectra at a single mass (termed feature maps), through to conventional multivariate methods such as principal components, clustering techniques and mixture models. However the feature maps based on a single mass tended to be poor at identifying features in the tissue while the multivariate methods tended to also produce poor images.
The solution was to convert the mass spectra to binary data (presence or absence at each mass), applying a spatial smoothing to the mass data and replacing the Euclidian norm (L2) with the cosine distance. The last is a technique perhaps better known amongst data scientists rather than mainstream statisticians, but its use is growing with high dimensional data. The results are promising in identifying different tissue types as in the central image below.
A final step has been to incorporate knowledge of what actually are cancerous cells to train the methods and select variables (masses) that best distinguish between cancerous and non-cancerous cells. The principle is to find masses that occur predominantly in cancer spectra but not outside, by looking at differences in proportions (DIPPS). The right image below shows the effectiveness of this.
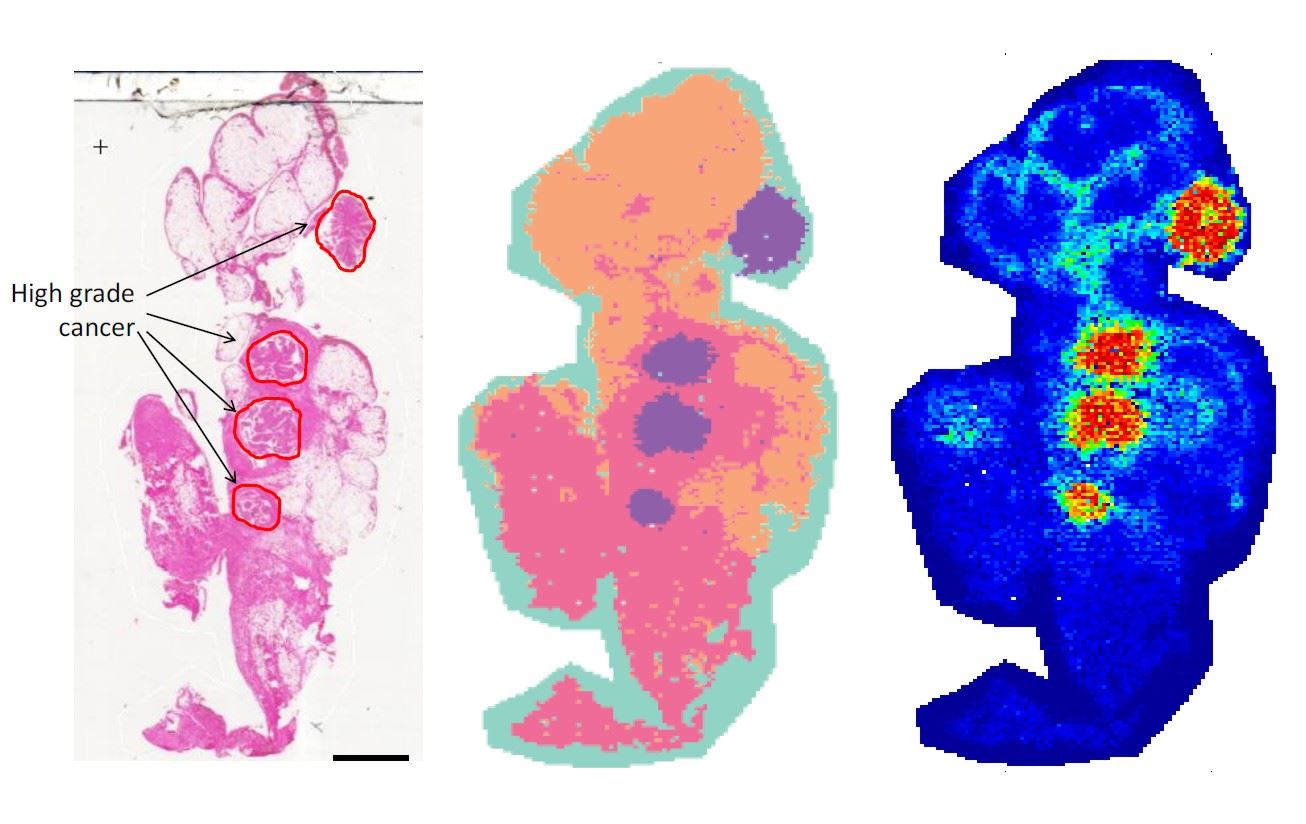
The stained tissue sample with cancerous areas marked (left), the results of cluster analysis (centre) and the prediction from masses chosen by the DIPPS principle (right).
After the meeting a number of members joined Inge for an enjoyable meal at a local restaurant, where the null hypothesis that statisticians are boring and unsociable was firmly rejected.
John Henstridge

 @StatSocAus